


Bitcoin (BTC) has continued its bullish assault late into the weekend. After rallying to and past $4,200 on Tuesday, the cryptocurrency continued higher throughout the week, currently sitting at a $5,150 valuation.
While some analysts have been adamant that this is where Bitcoin’s winning streak ends, as what some call “Bloody Monday” approaches, others have made a somewhat convincing case that further highs could be in store.
Late last month, NewsBTC reported that Filb Filb, a leading industry researcher, posted two charts in a bid to show that BTC could easily rally to $6,000 by the end of April.
The first was Bitcoin’s price action from July to late-December, but inverted. The second was the asset’s recent price action following December’s downturn, which has been, let’s say, lackluster. Although these two charts may sound nothing alike, Filb depicts eerie similarities both in the structure of moves and the timing, specifically in a bid to show that Bitcoin could see a massive wick to the upside.
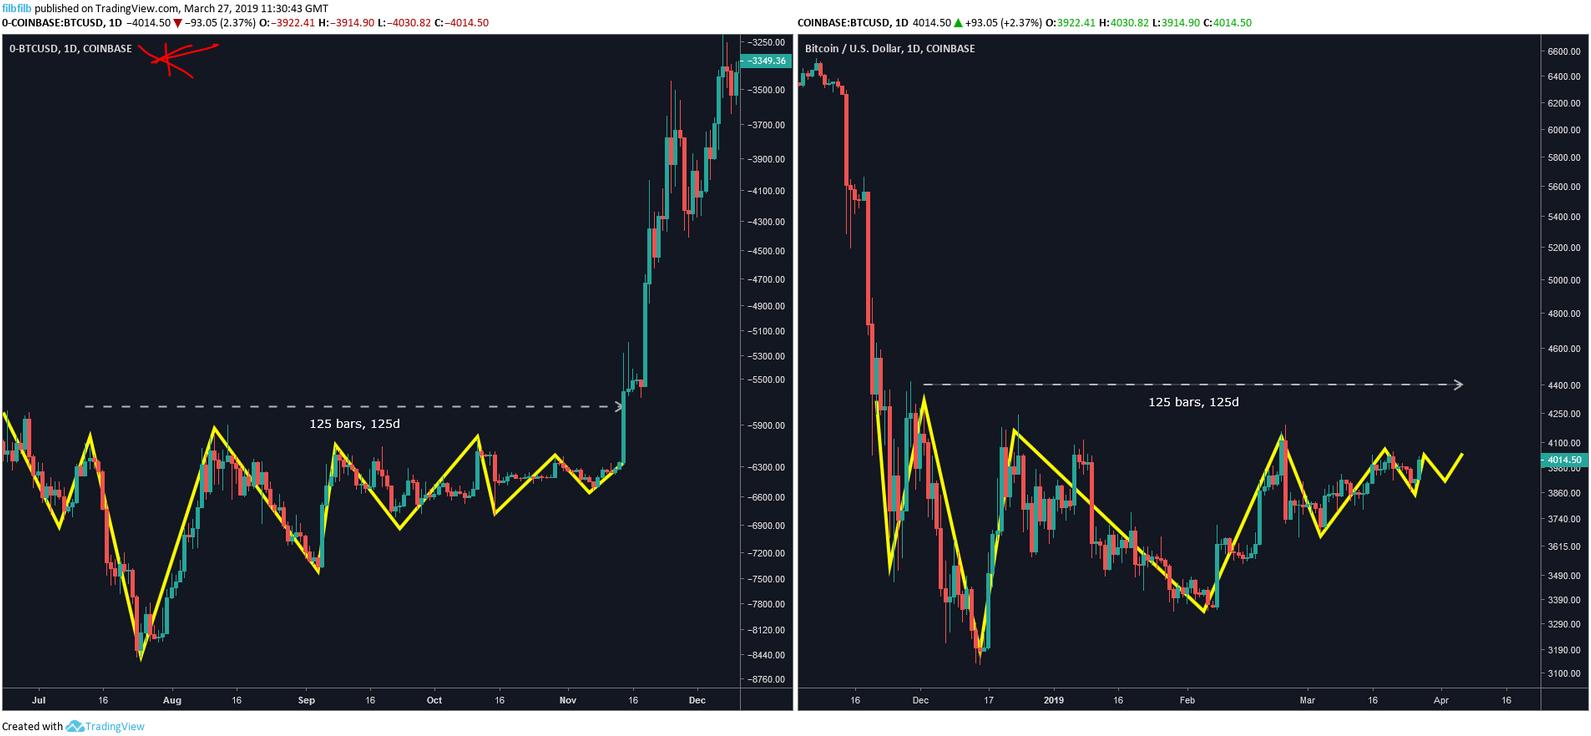
Many first cast his call aside, deeming it a mere coincidence that the charts share such similarities. But, with Bitcoin’s recent foray above $5,000, the lines that can be drawn between chart one and two have begun to mount. And as seen below, the structure of the recent move is still resembling that seen following the devastating Bitcoin Cash hard fork.
If this move, which could bring BTC to $6,000, is to play out in full, however, the cryptocurrency trader makes it clear that the Bitcoin price needs to hold above $4,950 in the coming days. If it doesn’t, the inverse fractal pattern is annulled.
Further Crypto Rally Might Not Be Possible
The stage may be set for a further move higher, but some have taken issue with the timing of this ongoing rally. Cryptocurrency advisor Josh Rager recently noted that Bitcoin’s ongoing move, if sustained, would totally destroy the theory that the asset follows set, multi-year trends. Of course, past performance is not indicative of future action, but some are convinced that BTC’s long-term price action can be charted many years in advance.
Another trader going by the moniker “throwaway” also recently made a similar point. He/she drew attention to the fact that Bitcoin has historically followed a logarithmic trendline, depicted in black below, effectively to a tee. But with the recent rally, the asset has moved well away from the “magnet”-esque trendline, meaning that a sell-off may actually be more likely than a rally higher.